Candle Range Theory (CRT) is not my invention, and I won't pretend it is. It's a way of reading the market that has circulated in the ICT community for years. What I do with it: give it exact rules, measure it, and keep a public record of it. This article explains the concept itself — no indicators, no magic.
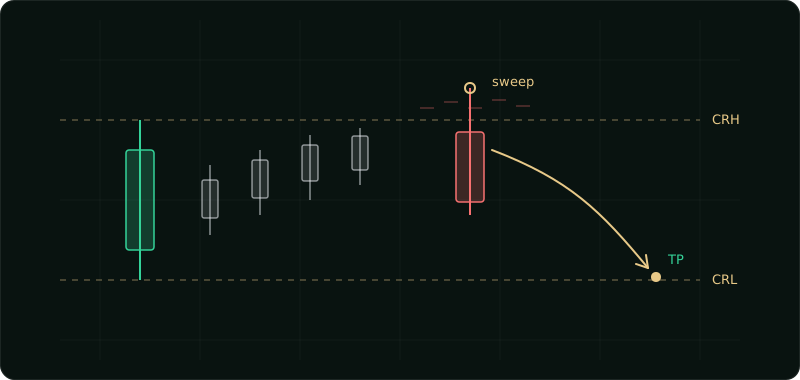
A candle as a range
Every candle on a chart — daily, four-hour or fifteen-minute — defines a range: a high and a low. CRT claims one simple thing: that boundary isn't just a line, it's a pool of liquidity.
Above the range high sit the stop-losses of sellers and the buy-stops of breakout traders. Below the low, the same picture mirrored. The market doesn't treat these levels randomly — it tends to seek them out, because that's where resting orders wait, and resting orders are what large positions need to get filled.
The sweep: taking liquidity
The key moment comes when price takes out the boundary and comes back. That's a sweep (or liquidity grab): the wick trades above the high, triggers the accumulated orders — and the candle body closes back inside the range.
Why is that information? Because a breakout that failed to hold means demand above the level wasn't enough. The liquidity is taken, the fuel is spent — and the path to the other side of the range is suddenly clearer.
From concept to rules
The concept alone isn't enough. "The market takes liquidity" is an observation, not a strategy. What makes the difference is precise definition: which candle defines the range, what exactly counts as a valid sweep, where the entry, stop and target go. Without that, CRT becomes hindsight storytelling — on a finished chart, every sweep looks obvious.
Model 1 is my answer to that question: sweep → close confirmation → limit order at the retest → stop beyond the sweep extreme → fixed 3R target, set & forget. The full process is described on the Strategy page.
What CRT is not
- It's not a crystal ball. In the GBPUSD backtest (2012–2026, 111 trades) the win rate comes out around 36%. Most trades lose — the model's math rests on the 1:3 ratio, not on being right.
- It's not a secret. The concept is public and covered in dozens of videos. The value isn't in the information — it's in execution discipline and in the data.
- It's not proof. A backtest at t≈2 is a hypothesis, not certainty. That's why I keep a live journal — the forward test will decide.
If you want to see the concept turned into mechanical rules, start with the Strategy page. And if you want to watch how it does in real time, the journal is open.