Guide
MODEL-1 — full guide
Every question about the indicator in one place: how to get access, how to read the dashboard, and what every row means — on one real trade.
Getting access
MODEL-1 will run through Whop — access opens once the journal holds thirty closed trades. When it's out, it's three steps:
- 01
Buy access
On the MODEL-1 page you pick a tier (monthly, quarterly, yearly) and pay through Whop.
- 02
Link your account
Whop walks you through linking your TradingView account — you just enter your TradingView username.
- 03
Add it in TradingView
The indicator shows up under your Invite-only scripts. You add it to the chart, and the MTF Candles companion next to it.
Access isn't open yet. Leave your e-mail below and you get the invite the moment it is.
Support and community
The community channel is being set up. Once it's live, this is where you'll find where to ask a question or report a problem. Until then, write to the e-mail in the footer.
Note: I will never contact you first asking for payment or login details. Ignore anything that does.
How to read the dashboard
Read it top to bottom. By the time MODEL-1 says TRIGGERED, every row above it has already been decided. The top block is the core signal, the bottom the context around it.
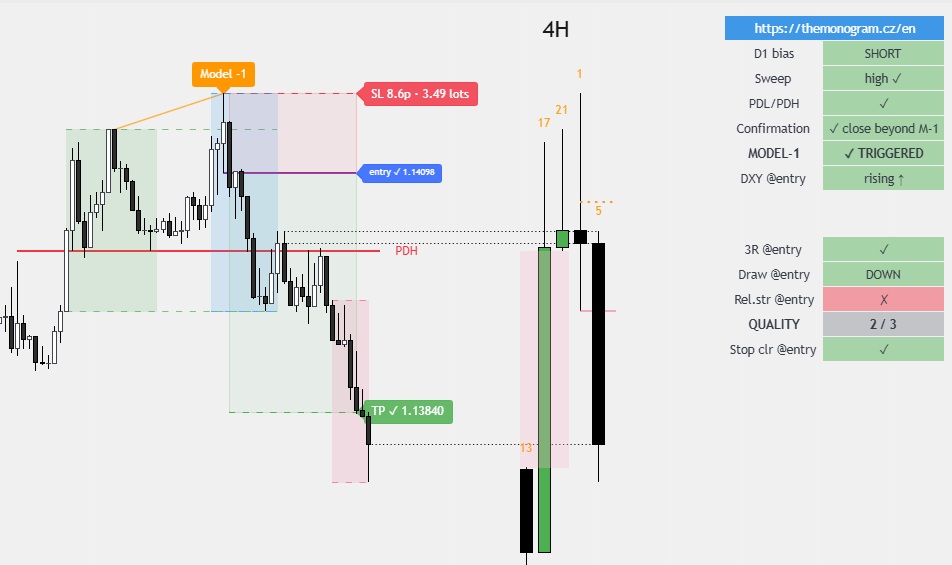
Core signal
- 1
D1 bias
Daily trend filter — daily close against its 20-period average. It greys out to “not relevant” when DXY already confirms the direction. Green supports the trade, red argues against it.
- 2
Sweep
Which side of the Asian range price took. “low ✓” means the Asian low was swept — a long setup. “high ✓” means the Asian high went — a short. This row sets the direction everything else is judged against.
- 3
PDL/PDH
Did that same sweep also take the previous day's low or high? Clearing prior-day liquidity makes the setup meaningfully stronger.
- 4
Confirmation
Did a candle close beyond the Model-1 level — the far edge of the sweep candle? That close is the cue to place the limit order.
- 5
MODEL-1
The trigger itself. “limit @ M-1” means confirmed and waiting for the retest. “✓ TRIGGERED” means the retest filled and the trade is live. It turns grey — “TRIGGERED (filtered)” — when the context score below is weak.
- 6
DXY
Dollar-index confluence. The dollar is the quote currency, so a short needs DXY rising and a long needs it falling. The mirror Model-1 on DXY has to confirm the opposite direction to the trade.
- 7
A+ SETUP
Lights up gold when every row above it is green. It grades the signal only — deliberately separate from the context block below, which is why A+ and a middling quality score can appear together.
Context
- 8
3R space
Is a 1:3 target realistic against actual liquidity? Risk is entry minus stop; the target is three times that. ✓ when the target sits inside the furthest opposing pool — prior day, today, H4 swing, Asia or weekly extreme. ✗ when it overshoots everything on the map.
- 9
Draw
Where liquidity is pulling price. Only the prior-day low taken → UP, which favours longs. Only the prior-day high → DOWN, favouring shorts. Both or neither → neutral. It turns red when the draw points against the signal.
- 10
Rel. strength
Relative strength against the other major — EURUSD against GBPUSD — measured from the daily open. The cleaner trade is shorting the weaker pair and buying the stronger one; this row flags when you are doing the opposite.
- 11
QUALITY
How many of the three context checks passed. Two or more failures downgrade the trigger to “TRIGGERED (filtered)” — the signal was valid, the surroundings were not.
Colour code
- Gold — core signal complete (A+)
- Green — check passed, supports the trade
- Red — check failed, argues against it
- Grey — neutral, waiting, or filter off
What this is
A decision-support tool, not signals. The dashboard grades a setup against mechanical CRT rules; the final call is discretionary. Every filter can be switched off individually, so its effect can be measured rather than assumed.
What the indicator draws on the chart
Beyond the dashboard, it draws the whole trade — from structure to entry, stop and target.
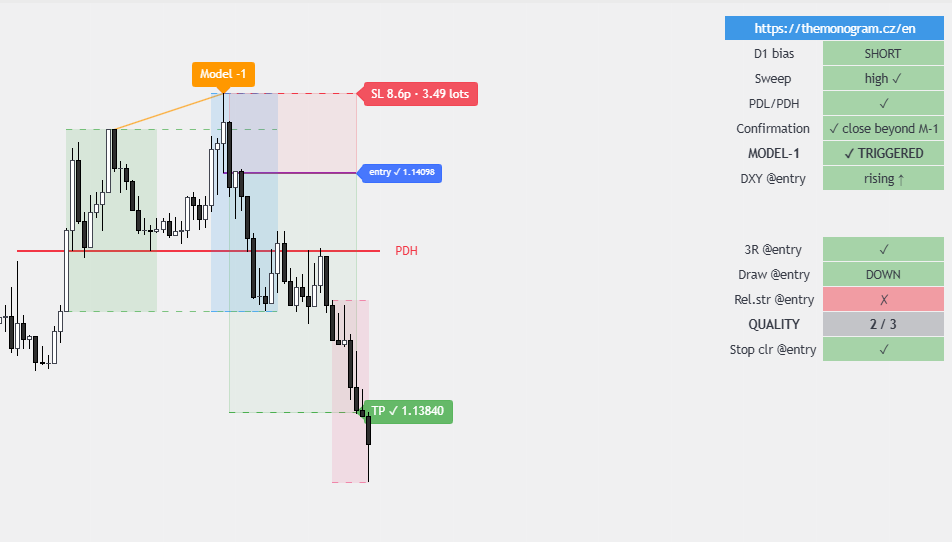
Entry, stop-loss and target
A limit at the Model-1 level, the stop beyond the extreme of the whole grab, the target fixed at 3R. It sizes the position in lots straight off that stop — SL 8.6p (risk: 3.49 lots) in the screenshot — so risk isn't a number I work out mid-session.
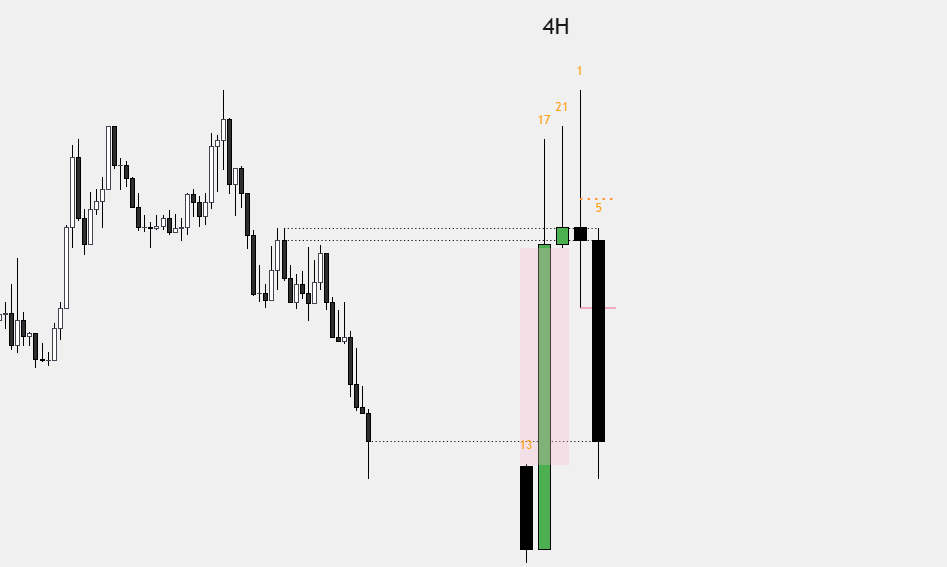
MTF Candles [theMonogram]
A companion indicator: it projects higher-timeframe candles onto the chart, so you see the higher context without switching. It runs next to MODEL-1 but takes no part in the trade decision.
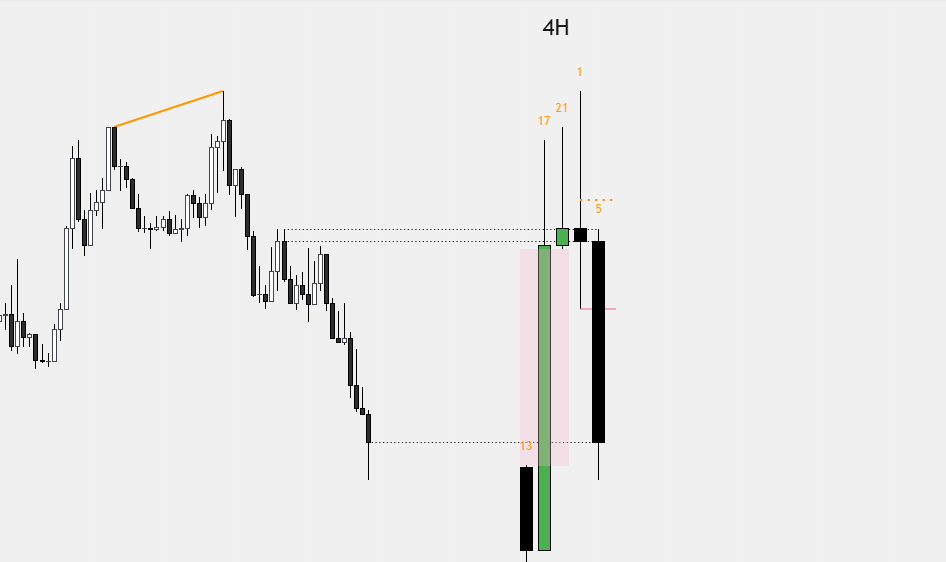
SMT and relative strength
Divergence between correlated pairs (EURUSD ↔ GBPUSD). When one takes liquidity and the other doesn't, that's SMT — the cleaner trade is shorting the weaker pair and buying the stronger.
The whole picture
Everything on one real trade: structure, sweep, order block, the Model-1 level, entry, stop, target — and the dashboard grading all of it beside them.
How I use it in a session
- 01
Before the session: the checklist in the corner of the chart shows the D1 bias and the state of liquidity — preparation takes minutes.
- 02
During the London killzone: the indicator marks the sweep, the Model 1 level and the confirmation; entry, stop and target are drawn exactly by the rules.
- 03
After the trade: the TP ✓ / SL ✗ markers turn a screenshot into a ready-made record for the journal and a case study.