Look into my journal and you won't find a single dollar. Every result is recorded in R — and that's deliberate, not shy. This article explains what the unit means and why I trust it more than amounts.
What 1R is
R is the risk on a single trade. When I enter a position, I know exactly where the stop-loss is — and the distance from entry to stop, translated through position size, is my R. In my case specifically 0.5% of the account, identical on every trade.
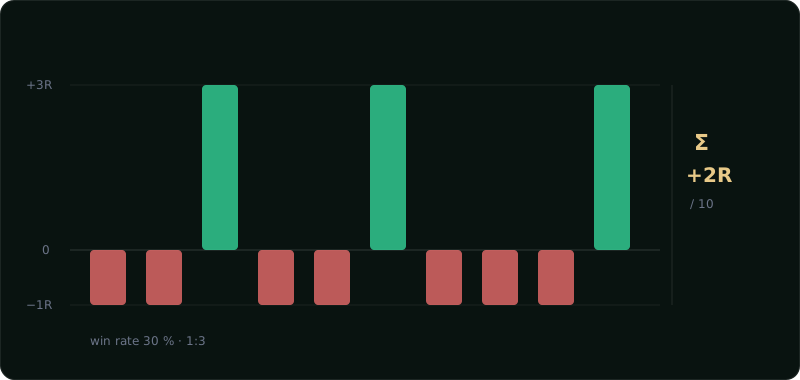
The result of a trade is then recorded as a multiple: stop-loss = −1.0 R. A target hit in Model 1 = +3.0 R, because the target is fixed at 1:3. The mechanical branch produces practically no other values — the model is set & forget, positions aren't managed.
Why not money
Amounts say nothing about the quality of decisions. A $500 win can be an excellent trade on a small account and a gamble on a large one. R is normalised — +3R means the same on a thousand-dollar account and a hundred-thousand-dollar one. A track record shown in dollars shows account size, not process quality.
Amounts invite storytelling. A balance screenshot is the cheapest marketing trick in trading content — and it says nothing about the risk that produced the balance. An R-multiple carries the risk information inside itself.
Account size is private, the process is public. That's the boundary I set for this site from day one.
How edge is read from R
The entire long-term math of a strategy fits into one number: average R per trade (expectancy). For Model 1, the GBPUSD backtest 2012–2026 gives roughly +0.24 R per trade at a win rate around 36%.
That combination is worth a close look: the model loses two times out of three, and the expectancy is still positive — because a win carries three times a loss. The reverse also holds: a high win rate by itself means nothing; a strategy that wins 90% of the time and occasionally drops −10R is a machine for burning accounts.
And honesty requires the footnote: the statistical strength of that backtest is t≈2, which is a hypothesis, not proof. That's exactly why the forward test runs — every journal entry either strengthens the hypothesis or chips away at it.
How to read my journal
When you look at the cumulative curve in the journal, you're reading a sum of R-multiples over time. It grows slowly, in single digits — and that's exactly what a record that isn't pretending should look like. Fast curves are drawn in Excel; mine is written one trade at a time.